XAUUSD Smart Money Concepts Dashboard
A local research environment that turns live MetaTrader 5 candles into annotated market structure, interactive analysis, and backtests designed to avoid future-data leakage.
- 5,000
- M15 candles processed
- 5 sec
- dashboard refresh
- 3
- export types
- Local
- private research workflow
The problem was fragmented analysis.
Problem
Market structure analysis lived in raw MT5 charts, manual annotations, and disconnected backtests. That made it slow to compare signals and easy to introduce inconsistent assumptions.
My individual role
I designed and built the Python data pipeline, indicator layer, interactive Plotly dashboard, static chart rendering, causal strategy simulation, exports, and automated tests.
One pipeline from live candle to tested idea.
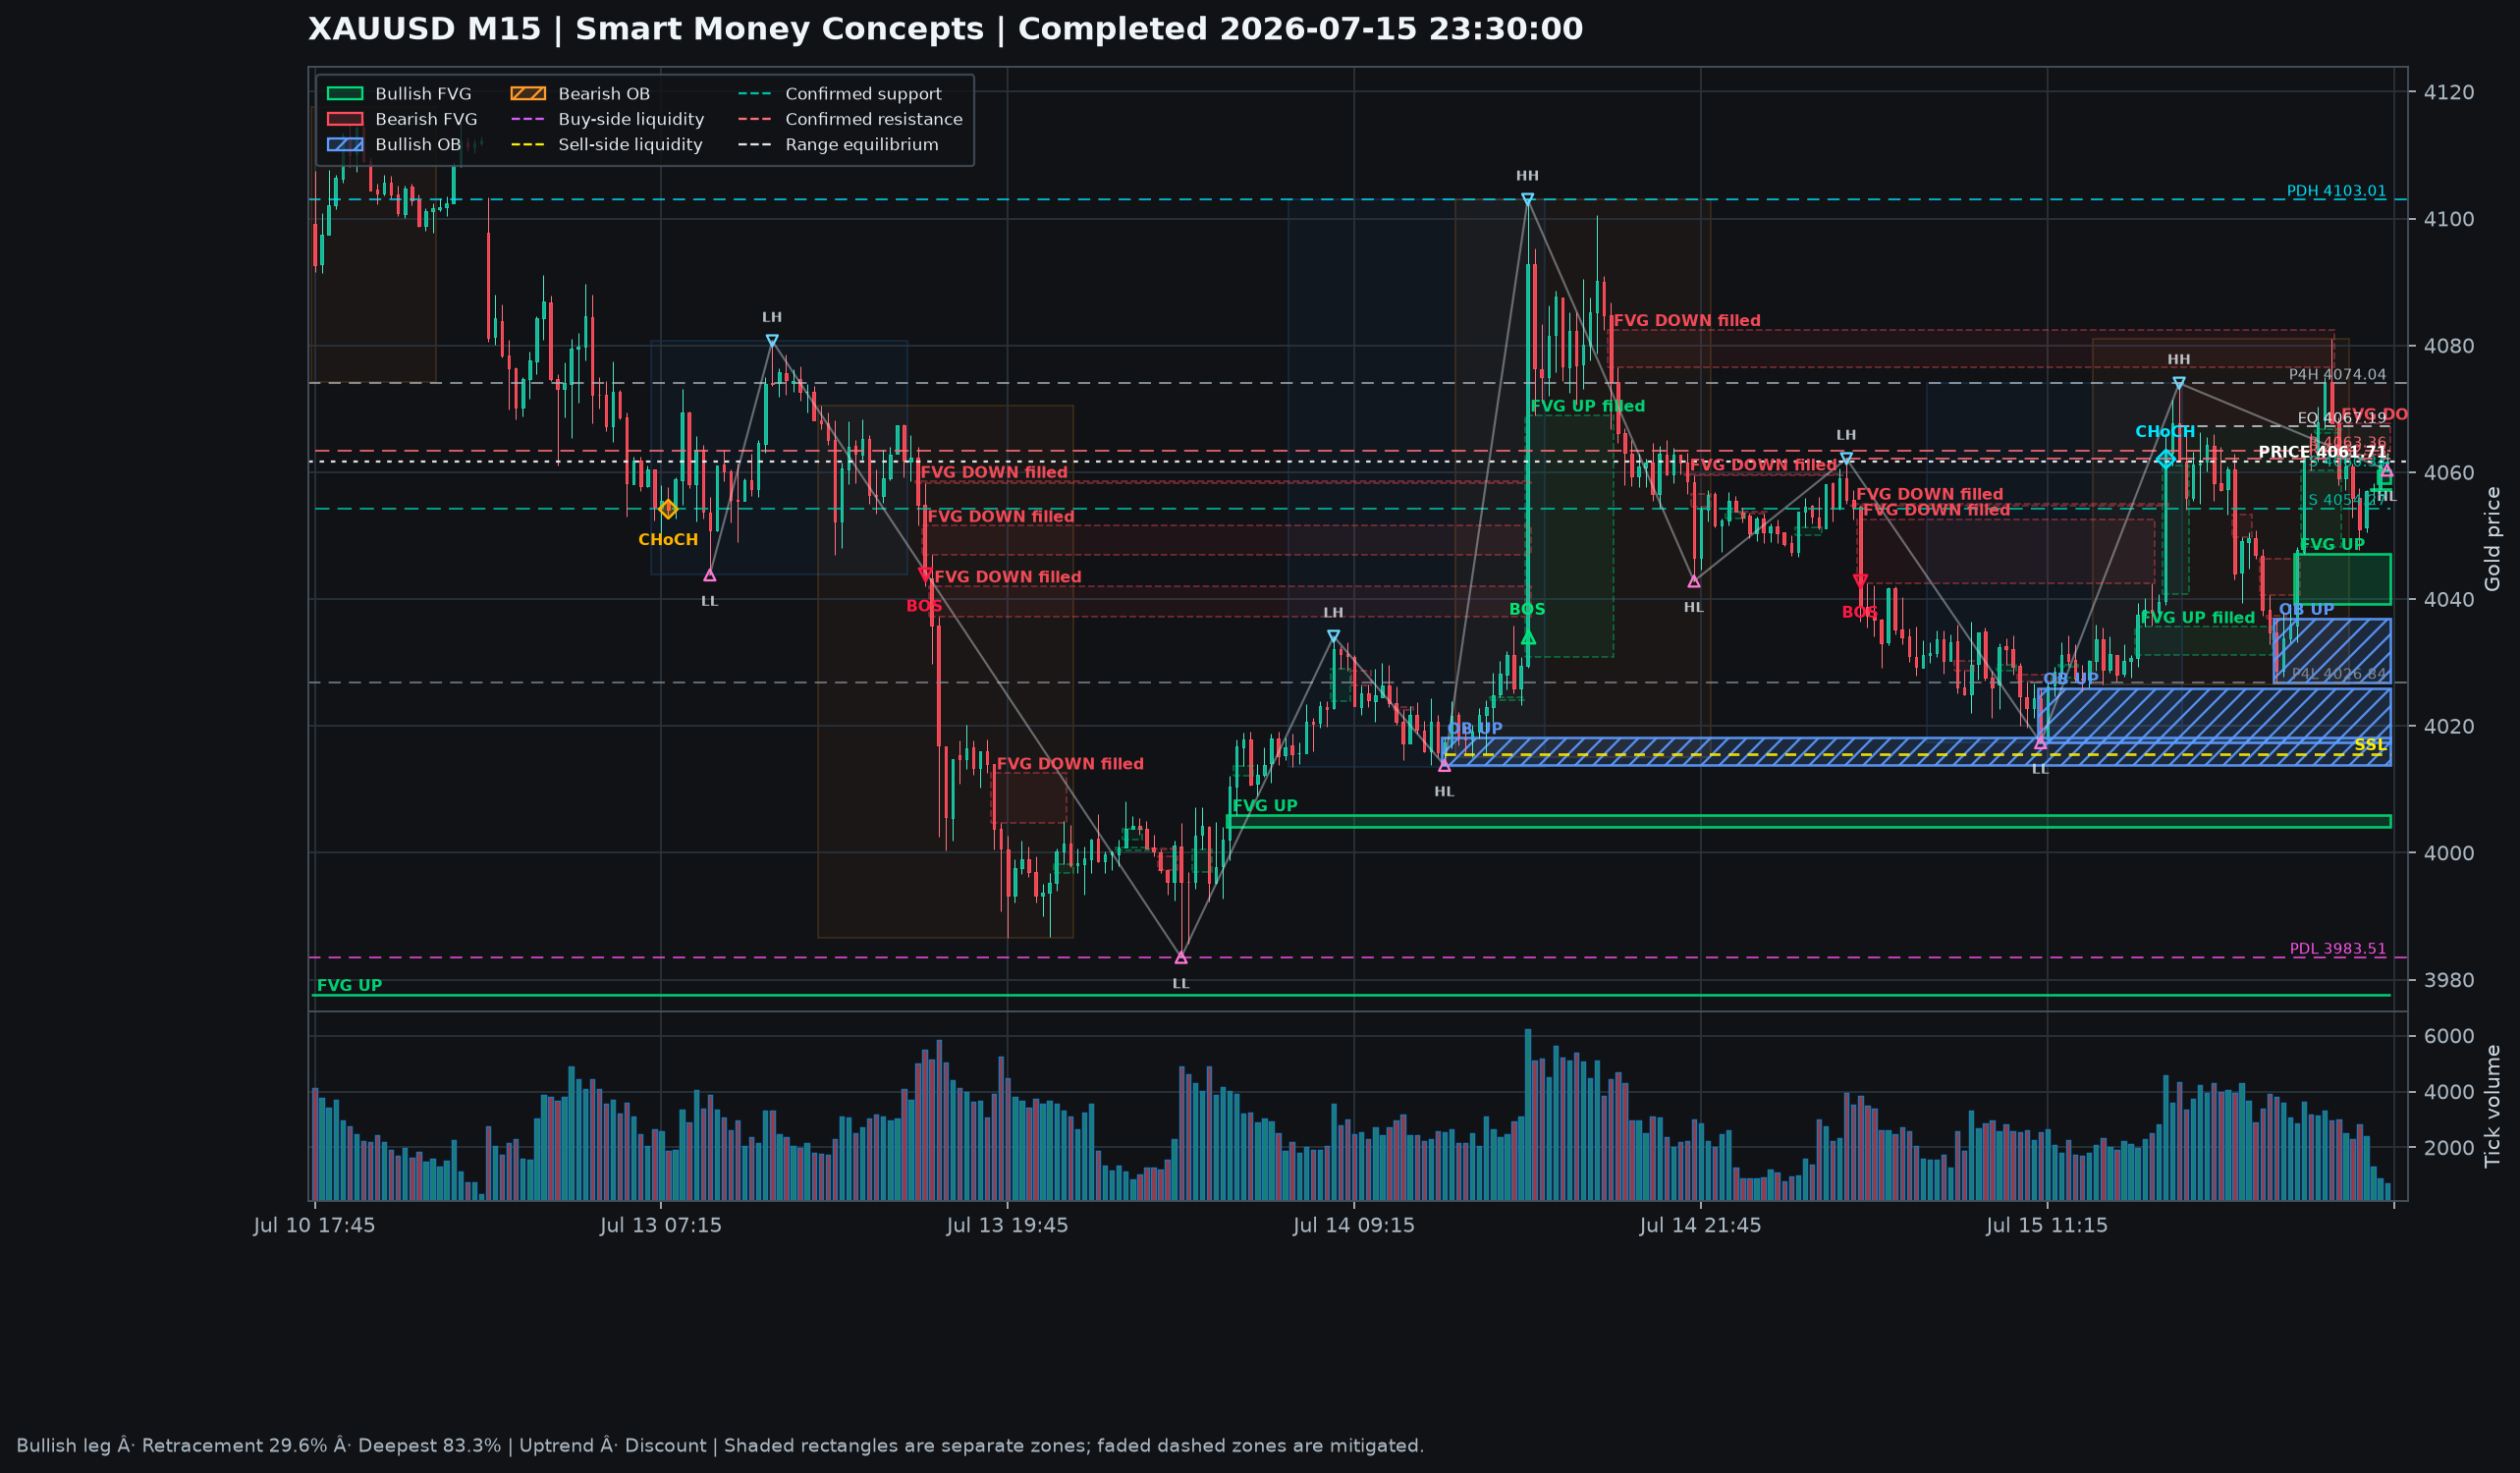
The application pulls XAUUSD M15 data from a local MetaTrader 5 terminal, derives market-structure features, visualizes them through two rendering paths, and sends confirmed signals into a causal backtest.
Swing-derived values are delayed until they could have been confirmed in real time. The strategy never receives a future pivot merely because it is visible in historical data.
The difficult choices protected analytical honesty.
Prevent look-ahead bias
Signals based on swing points are shifted until confirmation, trading a later signal for a backtest that better reflects information available at the time.
Keep signal semantics explicit
Data preparation, indicator calculation, rendering, and strategy logic stay separate so a visual annotation cannot silently become a trading rule.
Use a local-first workflow
The project connects to the user’s MT5 terminal and runs locally, keeping terminal access and research artifacts under the operator’s control.
Support two views of evidence
Plotly supports interactive inspection while mplfinance supports predictable static output, and both originate from the same processed dataset.
The working dashboard, not a concept mockup.
A faster, repeatable research loop.
- 5,000 candles per runThe dashboard loads a practical M15 analysis window from MetaTrader 5.
- Five-second refreshThe view can update automatically while keeping the research workflow local.
- Three export pathsCharts, backtest reports, and trade lists preserve the evidence behind a conclusion.
- Causal strategy evaluationConfirmed signal timing reduces the risk of results inflated by information from the future.
A paper-trading adapter and a versioned experiment registry would make comparisons between parameter sets easier to reproduce.